To get started with the program, teams need to add work items for each deliverable that supports the product vision. Each team can do that by working from their backlog and then mapping their work to create a hierarchy of work.
In this final post of using Azure DevOps with SAFe I'll walkthrough the steps for creating Epics, Features and Stories using Azure DevOps backlog, how to plan a sprint and review the team, program and portfolio progress using delivery plans and roadmaps.

Create & Manage Epics
We start by creating Epics on the portfolio backlog.
Open the Portfolio teams backlog and choose New Work Item.
Enter the title of the Epic and choose Add at selection.
Continue adding Epics as needed by continuing to type in their titles. You can add details later.
When finished, you should have a list of Epics as shown in the image.

At any point, you can add details to the epics. Click on the epic to open it and enter more details to the epic like description, assignee, comments, priority, risk, business value, effort, iteration, area path etc.
You can see that the WSJF value is automatically calculated and updated as the values for business value, priority, risk and effort changes.

Create and Manage Features
In a similar fashion to portfolio teams, program teams work from their Features backlog and define the features that support the Epics they are tasked with delivering.
Open the Program team's backlog by choosing Program team from the drop down list on the Backlog tab.
Choose the icon for view options (next to the filter and settings icon) and select Mapping. Choose the Portfolio Teams backlog of Epics to map the features to the Epics created by the portfolio team.
Now you can add Features the same way Epics were added on the portfolio teams backlog.
Feature details should be provided also with values for description, iteration, priority, business value, value area, risk and time criticality.
When finished you should have the list of features as in the image below.

Next step is to map each Feature to it's parent Epic. We can do this by dragging the feature on the backlog to it's parent Epic on the Mapping menu. When finished, you can turn off the Mapping pane by choosing Planning from the view options icon.

Similarly you can move features to certain iterations by dragging them to the respective PIs from the planning menu.

Create and Manage User Stories
Repeat the steps that were done for creating and mapping features to epics and later to iterations for User stories.

View progress rollup
Quick progress views are available from each team's backlog through rollup columns. For e.g. you can created a rollup column based on the progress of all workitems on the program team's backlog to track the work in progress.
From the program team's backlog, choose Column Options -> Add a rollup column and select Progress by all Work Items.

Delivery Plans, Feature timelines and Epic Timelines
Delivery Plans is an organizational tool that helps users drive cross-team visibility and alignment by tracking work status on an iteration-based calendar. Users can tailor their plan to include any team or backlog level from across projects in the account
Delivery Plans show the scheduled work items by sprint (iteration path) of selected teams against a calendar view. Delivery plans is also interactive. You can change the assigned sprint of a work item by dragging it to a new sprint.
Delivery Plans provide the needed multi-team view of your project schedule. For example, we use Delivery Plans internally to share the schedule of Features. By seeing the work many teams have planned for the next 3 sprints, we can easily discuss whether these are the right priorities and if dependencies exist.
Plans can be added from the Plans menu item under Boards.
Choose New Plan to add a plan
Fill in the form with name, description and specify the team backlog that you want to appear within the plan


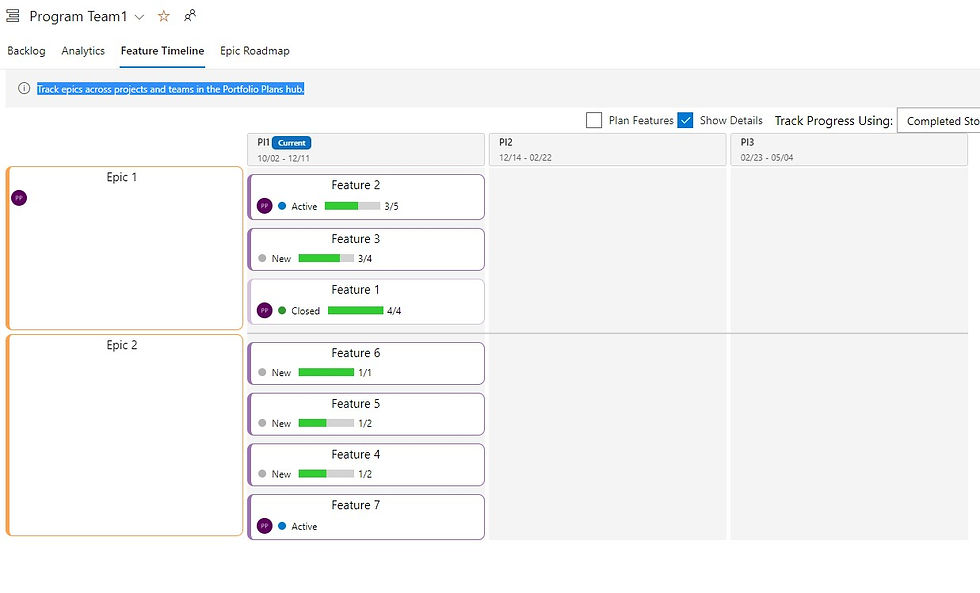
The feature timeline tool provides another view into progress of deliverables. Here we show the Program team 1's Epics as shown in the Feature Timeline tool. Progress bars are configurable based on completed stories or effort.

Productivity measurements (Cumulative flow, Lead & Cycle Time)
You use cumulative flow diagrams (CFD) to monitor the flow of work through a system. The two primary metrics to track, cycle time and lead time, can be extracted from the chart. Each Azure Boards backlog and board provide configurable CFD views. So each team at every level of SAFe implementation can monitor progress using these built-in charts. The Cumlative flow diagram can be accessed from the Analytics tab on each team's backlog.
Lead and Cycle time widgets can be added to the dashboard and configured at each team's backlog levels.

Summary
As you can see, its very easy to customize Azure DevOps for supporting SAFe. After PI Planning the teams can use Azure DevOps to assign the work to specific team members, adjust their initial estimates, and then execute and track the status of their work from within Azure DevOps.
Note that this is only one way of using Azure DevOps to support SAFe. Keep in mind that the flexibility of Azure DevOps and Azure DevOps Server makes it possible for us to customize based on your own implementation.
If you want to know more about Azure DevOps and how to make it work for SAFe. Leave a comment below or send me a message using the Contact page at this website.
Comments